Your monthly Social Security check arrives for the exact same dollar amount regardless of where you live. Yet the lifestyle that payment buys changes dramatically the moment you cross state borders.
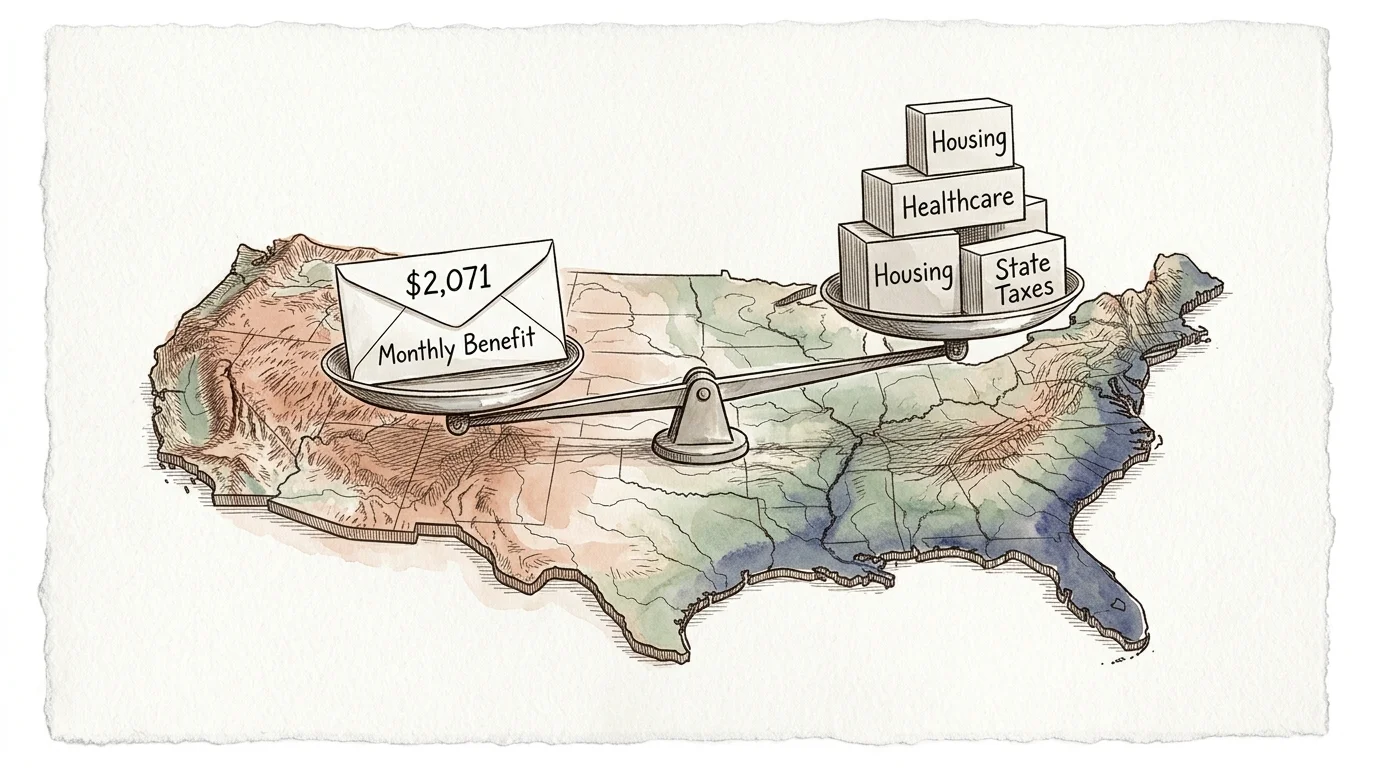
While the average retired worker benefit reached approximately $2,071 per month in 2026, living expenses vary wildly across the country. In high-cost regions, basic survival can easily devour your entire benefit check before you buy groceries.
Understanding the worst states for Social Security purchasing power helps you protect your hard-earned nest egg and make strategic location choices for your future.
Key Takeaways for Retirees
- Geographic disparities matter: A fixed monthly benefit provides comfortable stability in low-cost regions but falls short of basic living costs in expensive states.
- Hawaii ranks as the most expensive state: Sky-high shipping costs and elevated housing prices cause Social Security to cover less than half of monthly living expenses.
- State tax rules create double hits: In 2026, only eight states still levy income taxes on Social Security benefits, while 42 states and Washington, D.C., exempt them entirely.
- Housing remains the decisive factor: Median rents and property tax rates in coastal states quickly consume the average $2,071 monthly retirement check.
The Reality of Social Security Purchasing Power by State
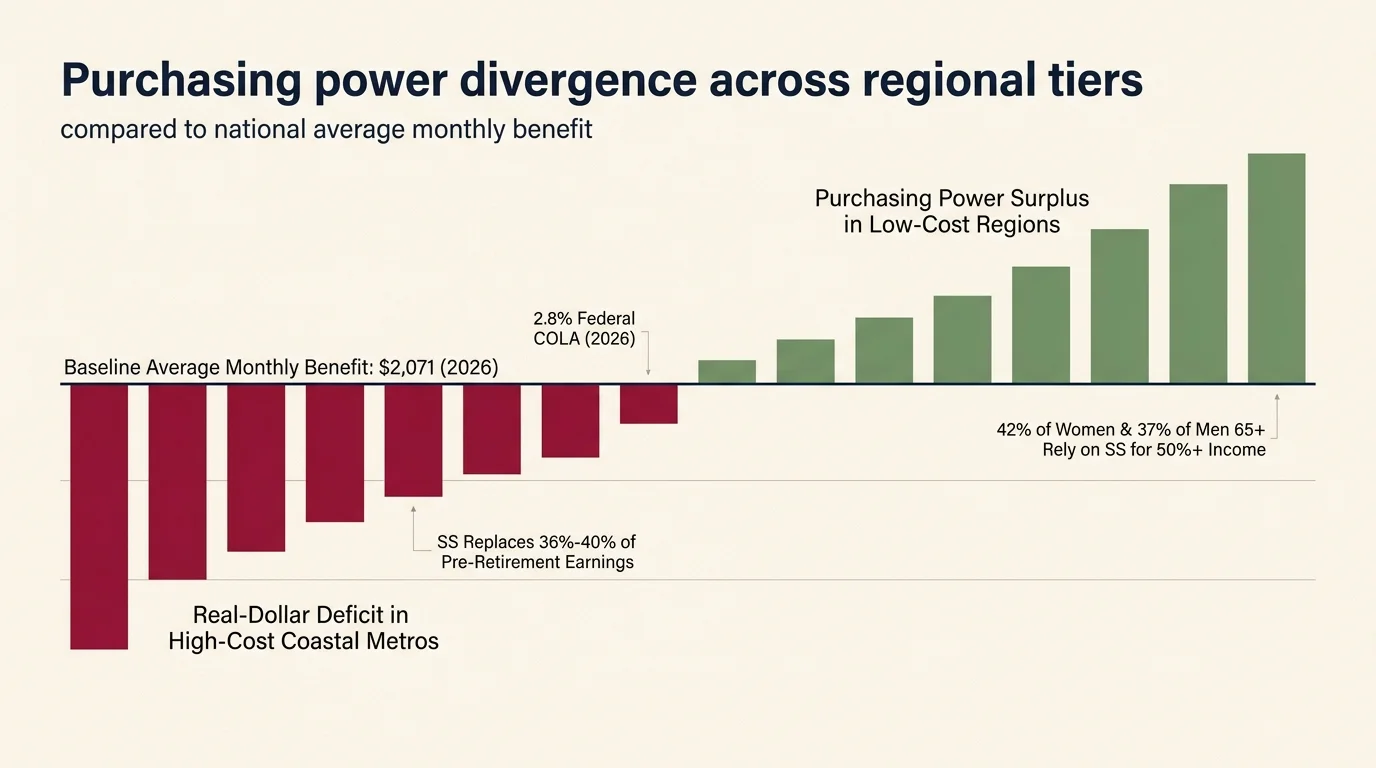
Social Security replaces roughly 36% to 40% of average pre-retirement earnings for American workers. For millions of seniors, these payments represent their primary financial foundation.
According to federal data, approximately 42% of women and 37% of men aged 65 and older rely on Social Security for at least half of their total income. That dependence makes local price levels critical to daily well-being.
The Social Security Administration calculated a 2.8% cost-of-living adjustment (COLA) for 2026, building upon a 2.5% increase in 2025. Even with steady adjustments, uniform federal COLAs cannot keep pace with regional inflation spikes.
Because federal payments do not adjust for local economic conditions, retirees in expensive metros face severe real-dollar deficits. A check that easily pays the bills in the Midwest barely covers rent in the Northeast.
“It’s not how much money you make, but how much money you keep, how hard it works for you, and how many generations you keep it for.” — Robert Kiyosaki
When you evaluate state cost of living Social Security metrics, looking beyond the raw benefit figure is vital. You must account for how housing, healthcare, utilities, and grocery bills erode your disposable cash.

The 5 States Where Social Security Stretches the Least
Certain states consistently diminish retirement purchasing power through high baseline prices and demanding local economies. Here are the five states where your retirement benefit faces the steepest uphill climb.
1. Hawaii: The Nation’s Most Challenging Retirement Budget
Hawaii consistently ranks as the state where Social Security covers the lowest percentage of basic living costs. The state composite cost-of-living index sits roughly 80% to 90% above the national baseline.
Because island communities import the vast majority of consumer goods, groceries and energy costs remain astronomical. Electricity rates in Honolulu regularly double or triple mainland averages.
An average monthly Social Security benefit of $2,071 covers only a fraction of average island rental prices. Without substantial supplemental savings or family support, retiring here on fixed benefits creates immediate financial strain.
2. California: Elevated Housing and Everyday Friction
California presents massive cost obstacles for retirees who rely primarily on Social Security income. The Golden State features median home prices and rental rates running nearly double the national median.
State gasoline taxes, high utility rates, and elevated sales taxes continuously chip away at fixed budgets. Even outside major urban hubs like San Francisco or Los Angeles, rural living costs remain elevated.
While California does not tax Social Security benefits, high general taxes and housing costs quickly overwhelm that single tax advantage. Retirees must allocate large portions of private savings just to bridge the gap.
3. New York: Heavy Downstate Costs and Steep Property Taxes
New York remains one of the worst states for Social Security purchasing power due to extreme regional expenses. Downstate living costs in New York City, Long Island, and Westchester County rank among the highest worldwide.
Even in scenic upstate communities, high local property taxes can easily consume over half of a retiree’s annual benefit. Older homeowners often find their paid-off houses unaffordable due to annual tax assessments.
The state fully exempts Social Security benefits from state income taxes, but general sales and utility rates keep monthly living expenses persistently high.
4. Massachusetts: High Healthcare and Housing Overhead
Massachusetts offers world-class medical facilities, but the overall cost structure poses significant challenges for fixed-income seniors. Home prices and healthcare costs track far above national medians.
Harsh winter conditions also drive up seasonal heating bills, adding hundreds of dollars to monthly winter utility expenses. Routine maintenance and contractor services carry steep premiums across the state.
While Massachusetts exempts Social Security benefits from state income taxation, the high cost of everyday goods limits discretionary spending for fixed-income residents.
5. Alaska: Extreme Logistical Costs and Cold-Weather Utility Bills
Alaska does not levy a state income tax or general state sales tax, yet fixed benefits struggle here. The state remote location drives up transportation, food, and consumer goods pricing substantially.
Sub-zero winter temperatures demand continuous home heating, leading to fuel and power bills that can exceed several hundred dollars each month. Healthcare delivery in remote areas also carries severe price tags.
Annual payments from the Alaska Permanent Fund dividend provide helpful cash infusions, but they rarely offset the relentless pressure of baseline living expenses.

Comparing Social Security Purchasing Power Across States
To see how far a standard retirement benefit goes, examine this state-by-state cost comparison. The baseline national average index sits at 100.
| State | Cost of Living Index | Average Monthly Benefit | Est. Monthly Housing Cost | Benefit Value Relative to Baseline | State Taxes on Benefits |
|---|---|---|---|---|---|
| Hawaii | 186.2 | $2,071 | $2,450 | Severely Diminished | Exempt |
| California | 138.5 | $2,071 | $1,950 | Significantly Reduced | Exempt |
| Massachusetts | 144.1 | $2,071 | $1,900 | Significantly Reduced | Exempt |
| New York | 127.8 | $2,071 | $1,720 | Moderately Reduced | Exempt |
| Alaska | 125.4 | $2,071 | $1,480 | Moderately Reduced | Exempt |
| Connecticut | 116.3 | $2,071 | $1,510 | Moderately Reduced | Taxed for High Earners |
| Colorado | 104.8 | $2,071 | $1,620 | Near Baseline | Taxed (Generous Exemptions) |
| Minnesota | 96.2 | $2,071 | $1,180 | Above Baseline | Taxed (Phased Exemptions) |
| Mississippi | 85.3 | $2,071 | $890 | Significantly Stretched | Exempt |
| Iowa | 89.7 | $2,071 | $940 | Significantly Stretched | Exempt |
As the table illustrates, identical benefit checks yield radically different standards of living. In low-cost states, your benefit easily covers housing with funds left over for healthcare and leisure.

The Tax Bite: 8 States That Still Tax Benefits in 2026
High retail prices are not the only threat to your monthly check. State-level tax policy can also reduce your net retirement income.
As of 2026, only eight states continue to tax some portion of Social Security retirement benefits: Colorado, Connecticut, Minnesota, Montana, New Mexico, Rhode Island, Utah, and Vermont.
Fortunately, state lawmakers across the nation have recognized the burden of taxing fixed-income seniors. Kansas, Missouri, and Nebraska recently eliminated all state taxes on Social Security payments.
West Virginia also finalized its multi-year phaseout, ensuring that residents keep their entire state benefit. Today, 42 states plus Washington, D.C., leave your Social Security checks completely untouched by state income tax.
Even among the eight taxing states, many provide income-based exemptions. If your adjusted gross income stays below established state thresholds, you may owe nothing at tax time.

Federal Tax Thresholds That Erode Your Benefits
Regardless of where you reside, federal taxes can impact your benefit if you have supplemental retirement income. The federal government uses your “combined income” formula to determine taxable portions.
Your combined income equals your adjusted gross income, plus non-taxable interest, plus 50% of your annual Social Security benefits. These federal thresholds have remained unindexed for inflation since 1984.
If you file as an individual, combined income between $25,000 and $34,000 makes up to 50% of benefits federally taxable. Income above $34,000 exposes up to 85% of your benefits to federal taxation.
For married couples filing jointly, combined income between $32,000 and $44,000 triggers federal taxes on up to 50% of benefits. Joint income over $44,000 makes up to 85% taxable.
You can model how withdrawals from 401(k) plans or IRAs affect these limits using tools from the Consumer Financial Protection Bureau.

Housing and Healthcare: The Primary Budget Drivers
Housing represents the single largest expenditure in retirement budgets across every state. When housing absorbs more than 30% of your gross income, you become officially housing cost-burdened.
In high-cost states like California and Hawaii, average rents exceed the entire $2,071 national average Social Security payment. That imbalance forces retirees to drain personal investment accounts rapidly.
Healthcare expenses represent the second major spending challenge for older adults. You must account for standard Medicare Part B premiums, supplemental coverage, and prescription drug costs.
Review comprehensive coverage choices and state assistance programs directly on Medicare.gov before setting your retirement budget. Out-of-pocket medical expenses often surge in high-overhead metropolitan regions.
“The best time to plan for retirement was 20 years ago. The second best time is today.”

Where Social Security Goes Furthest: Strategic Alternatives
Retirees seeking to maximize their benefit purchasing power frequently look to more affordable regions. States across the Midwest and Southeast offer compelling cost advantages.
In states like Mississippi, Arkansas, Alabama, and Oklahoma, overall living costs track 10% to 15% below the national baseline. Modest local housing prices allow your benefit check to cover all essential needs.
Relocating from a high-cost coastal market to a lower-cost state effectively functions like a substantial pay raise. You capture immediate savings on property taxes, auto insurance, and daily services.
However, successful relocation requires evaluating factors beyond real estate prices. You must also consider proximity to quality healthcare networks, family support systems, and climate preferences.
Don’t Make These Mistakes
Navigating Social Security requires careful strategic planning to avoid costly lifestyle traps. Here are critical errors to avoid when choosing where to live in retirement:
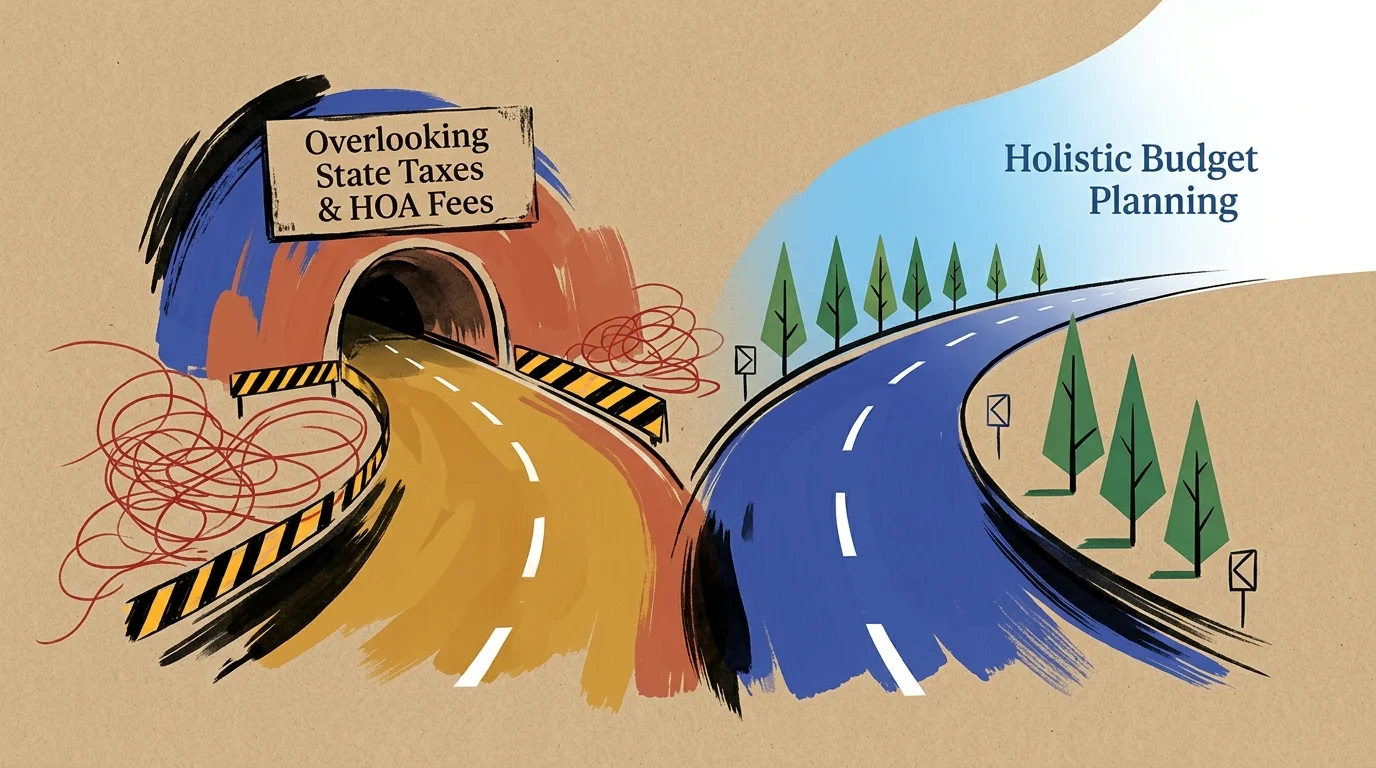
- Assuming COLAs solve regional price spikes: Federal adjustments reflect national price indexes rather than local rent increases or utility rate hikes.
- Overlooking local property tax assessments: A paid-off mortgage does not protect you from skyrocketing county tax assessments on coastal properties.
- Ignoring state tax rules on retirement withdrawals: A state might exempt Social Security while heavily taxing pension distributions or traditional IRA withdrawals.
- Claiming benefits early to fund an expensive move: Claiming at age 62 permanently locks in a 30% benefit reduction compared to waiting for full retirement age.
- Neglecting out-of-pocket medical costs: Healthcare provider networks and Medicare Advantage plan premiums vary significantly between urban and rural counties.

When Professional Advice Is Worth It
Evaluating multi-state tax rules and retirement cash flows can quickly become complex. Working with qualified retirement specialists helps prevent costly claiming and relocation errors.
You can connect with free, objective guidance through your local State Health Insurance Assistance Program (SHIP). SHIP counselors explain Medicare supplement options and local premium assistance programs.
Low-income seniors and adult children assisting parents should visit BenefitsCheckUp. This service identifies local utility discounts, property tax relief programs, and nutrition support.
If you own significant assets or plan a multi-state move, consult a fee-only Certified Financial Planner (CFP). A planner will model your long-term tax liabilities and protect your nest egg.
Elder law attorneys can also establish proper residency documentation, update estate planning documents, and structure assets for Medicaid long-term care compliance.
Frequently Asked Questions About State Social Security Costs
Why does Social Security buy less in certain states?
Social Security checks use uniform national calculations that do not adjust for local living costs. High regional housing, utility, and grocery expenses significantly reduce your purchasing power in expensive states.
Which states tax Social Security benefits in 2026?
Only eight states still tax some portion of Social Security income in 2026: Colorado, Connecticut, Minnesota, Montana, New Mexico, Rhode Island, Utah, and Vermont. Most offer income-based deductions.
Does moving to a cheaper state increase my monthly check?
No, your monthly benefit amount remains identical regardless of where you establish residency. However, lower local prices allow that same dollar amount to cover a substantially higher standard of living.
How does the 2026 COLA impact my purchasing power?
The 2.8% COLA for 2026 boosts monthly checks to help offset inflation. However, if your local utility or housing costs rise faster than 2.8%, your overall purchasing power still declines.
Take Control of Your Retirement Location Strategy
Your Social Security benefits represent decades of hard work and dedicated payroll contributions. Ensuring those monthly dollars deliver comfort and peace of mind requires proactive location and budget planning.
Take time this week to review your monthly spending, compare regional cost indexes, and evaluate how state tax policies affect your bottom line. Making smart geographic choices empowers you to stretch your benefit check further.
Information in this article reflects current rules as of the publication date and may change. Always confirm benefit details directly with Social Security Administration, Medicare.gov, or relevant government agencies before making decisions.
Last updated: February 2026. Medicare and Social Security rules change annually—always verify current details at official government sources.