Checking your monthly pension check against state and national benchmarks gives you genuine clarity about your retirement security. While roughly 31% of older Americans receive a defined-benefit pension today, payouts differ dramatically across state borders.
If you wonder, “how does my pension compare,” you must examine more than just the raw dollar amount. Local living costs, Social Security participation, and inflation protections directly determine what that check buys.
This guide breaks down pension benefits by state so you can see where your income stands. You will also learn how to evaluate your plan’s true purchasing power over time.
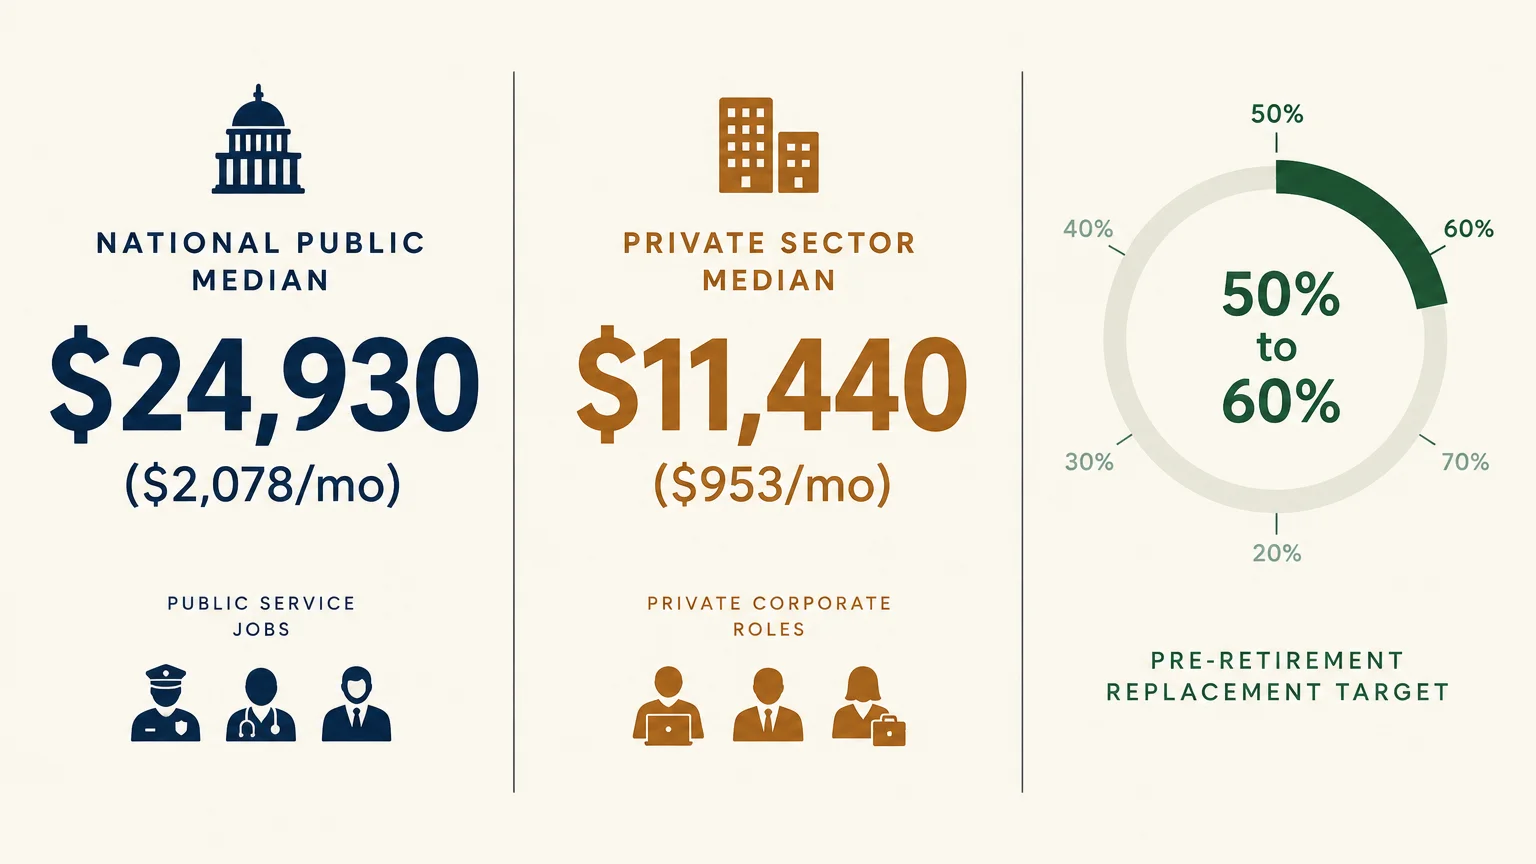
Key Takeaways: Pension Benchmarks at a Glance
- National Public Median: State and local government retirees receive a median benefit of $24,930 annually (around $2,078 per month).
- Private Sector Reality: Private pension recipients receive a median of $11,440 per year ($953 per month), reflecting fewer years of service and lower accrual rates.
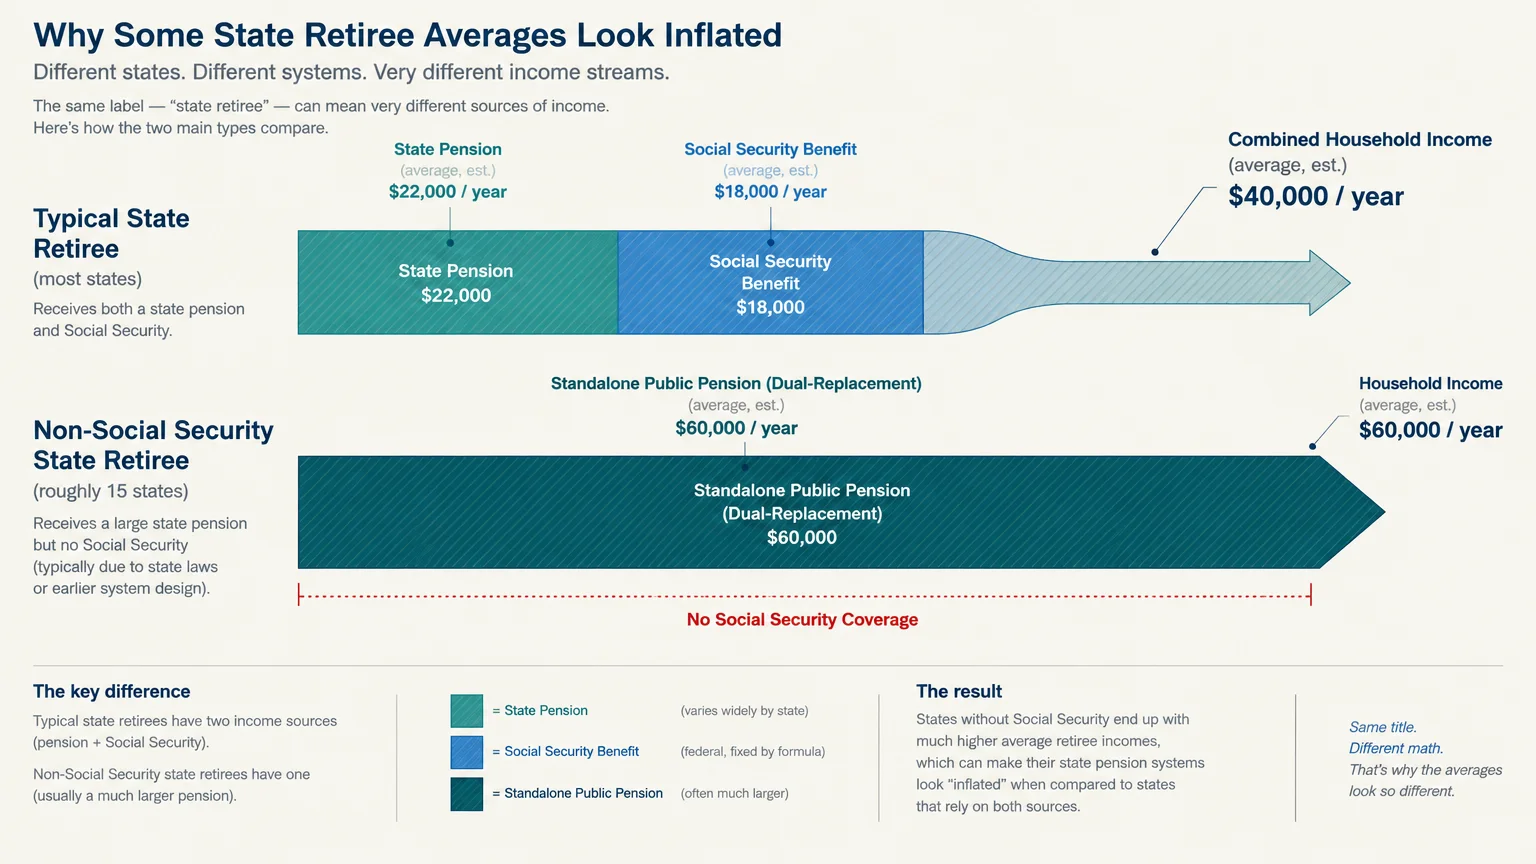
- Social Security Exclusions: Public employees in roughly 15 states do not pay into Social Security, making their pensions appear much higher because they replace two income streams.
- The Replacement Target: A solid pension replaces 50% to 60% of your pre-retirement earnings; combined with personal savings, aim for 70% to 80% total income replacement.
- Inflation Protection Matters: A plan with an automatic, compounded Cost-of-Living Adjustment (COLA) preserves your standard of living far better than a static payout.
The National Baseline: What Does the Typical Pension Pay?
Pension plans fall into distinct categories, and comparing them requires understanding who pays the benefit. Your former employer type plays the biggest role in setting your monthly check.
According to data from the U.S. Census Bureau and the Pension Rights Center, payout sizes diverge sharply between sectors. Public service careers consistently produce significantly larger benefits than private corporate plans.
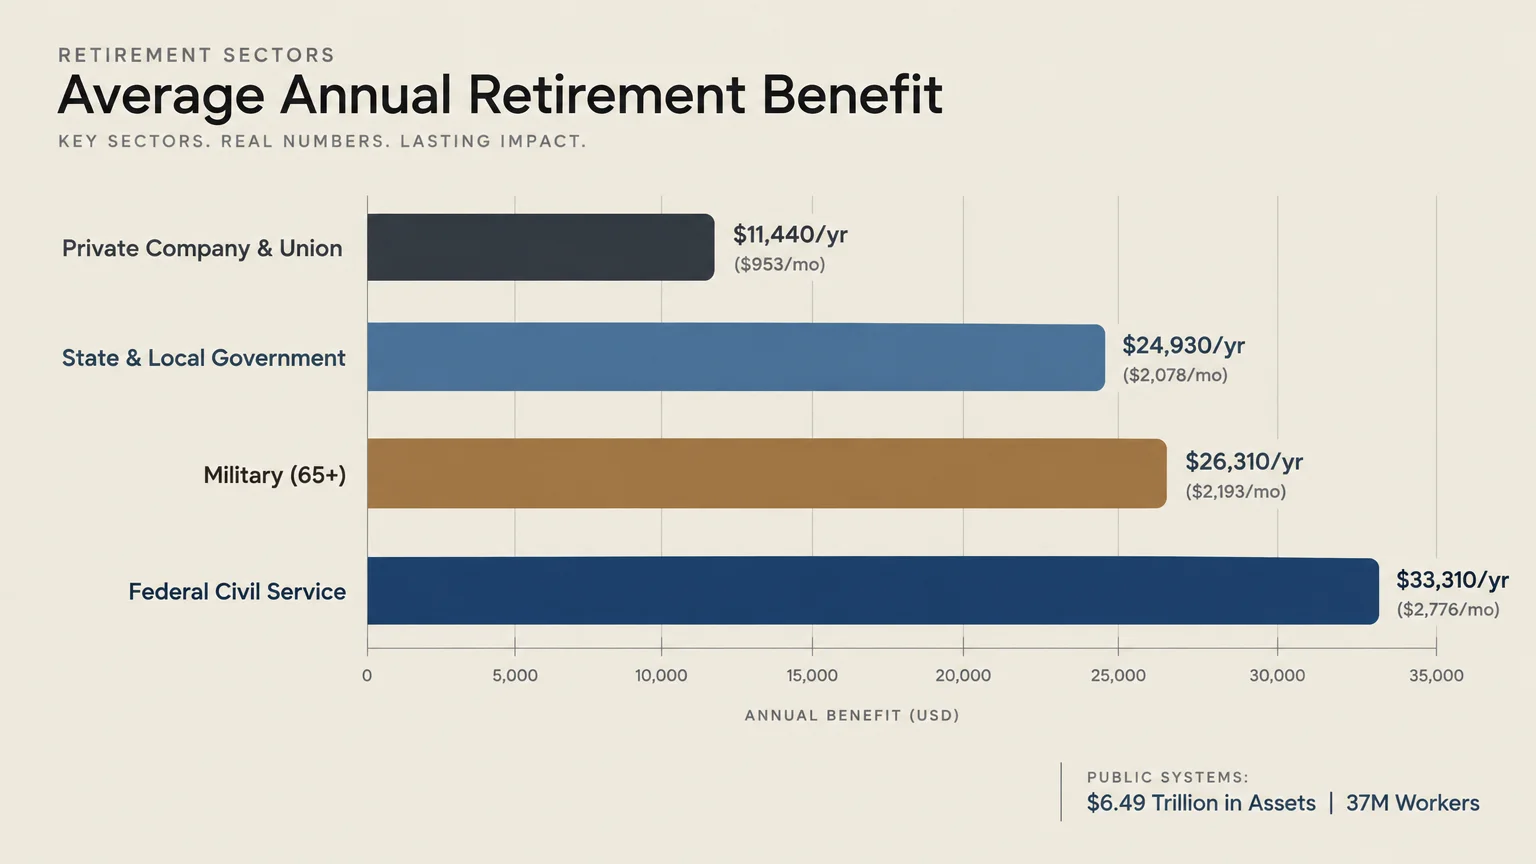
The median annual pension payouts across major plan categories show clear divisions:
- Private Company & Union Pensions: $11,440 per year ($953 per month)
- State & Local Government Pensions: $24,930 per year ($2,078 per month)
- Military Pensions (Retirees 65+): $26,310 per year ($2,193 per month)
- Federal Civil Service Pensions: $33,310 per year ($2,776 per month)
Access to these checks has also shifted. Only about 15% of private industry employees have access to a defined-benefit pension plan today.
In contrast, over 85% of state and local government employees retain pension access. Today, state and local retirement systems hold $6.49 trillion in assets and support over 37 million active and retired workers.
State Pension Comparison: Average Payouts Across the Country
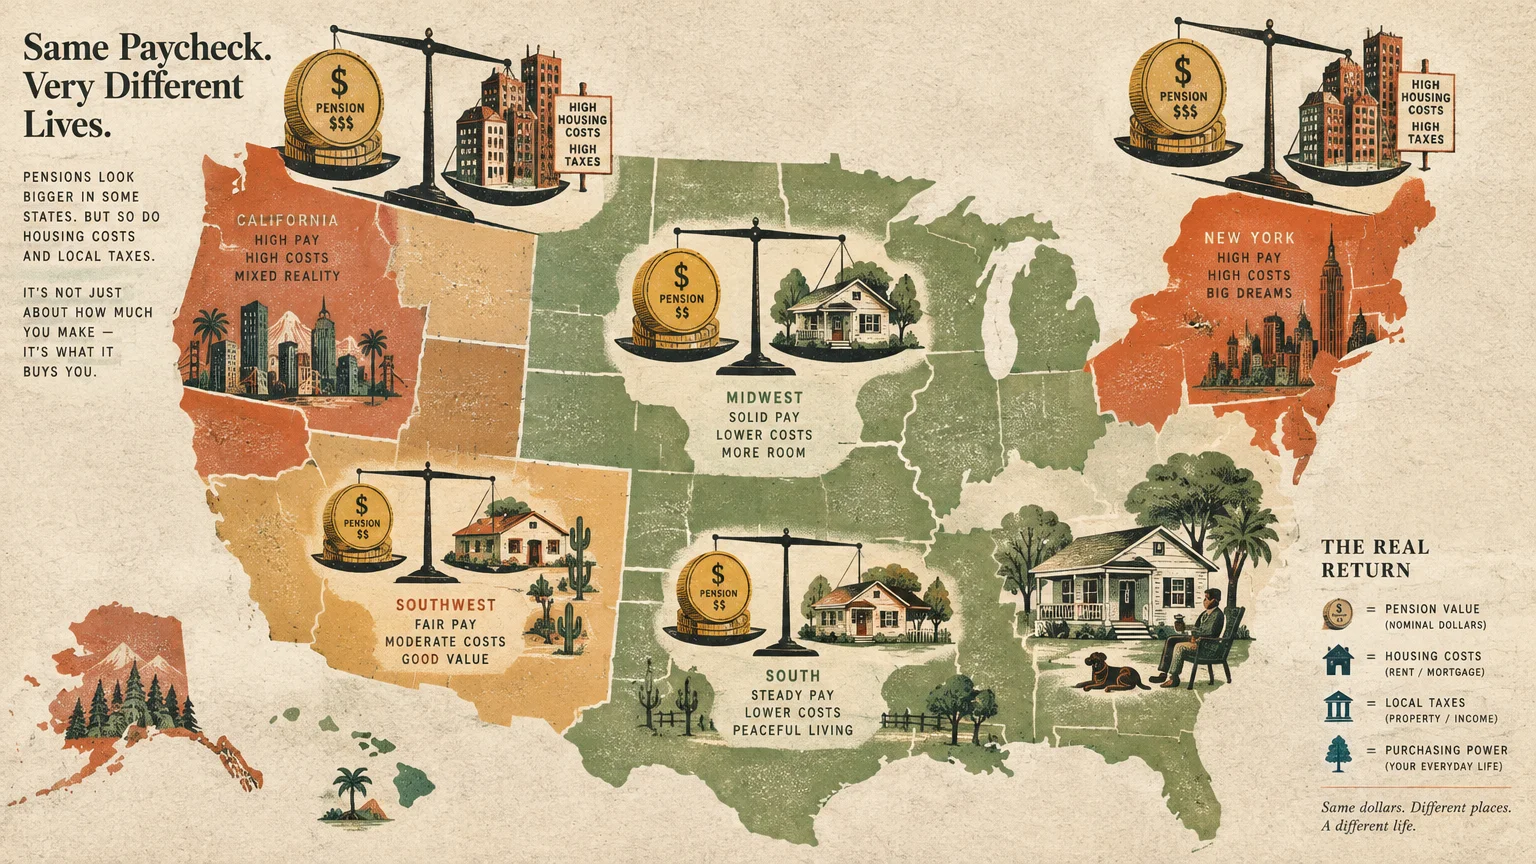
State-level pension benefits reflect regional economic conditions, union density, and state legislative history. Retirees in high-cost states often receive payouts that appear massive compared to southern or rural Midwestern states.
However, higher payments in states like California, New York, and Nevada often offset steep housing costs and local tax rates. Meanwhile, states with lower median pensions frequently offer much lower costs of day-to-day living.
The table below provides a state pension comparison using data from state annual comprehensive financial reports and U.S. Census public pension surveys. It highlights major state employee and teacher retirement systems.
| State | Primary System(s) | Average Annual Benefit | Average Monthly Benefit | Social Security Covered? |
|---|---|---|---|---|
| California | CalPERS / CalSTRS | $39,800 | $3,317 | CalPERS (Yes) / CalSTRS (No) |
| New York | NYSLRS / NYSTRS | $34,200 | $2,850 | Yes |
| Illinois | SURS / TRS / SERS | $41,500 | $3,458 | Mostly No |
| Ohio | OPERS / STRS | $32,400 | $2,700 | No |
| Nevada | NV PERS | $42,100 | $3,508 | No |
| Colorado | Colorado PERA | $38,900 | $3,242 | No |
| Texas | ERS / TRS | $27,100 | $2,258 | ERS (Yes) / TRS (Mostly No) |
| Pennsylvania | SERS / PSERS | $28,600 | $2,383 | Yes |
| Florida | Florida FRS | $22,400 | $1,867 | Yes |
| North Carolina | TSERS | $23,800 | $1,983 | Yes |
| Indiana | INPRS | $16,900 | $1,408 | Yes |
| Mississippi | PERS Mississippi | $24,100 | $2,008 | Yes |
| West Virginia | WV CPRB | $18,200 | $1,517 | Yes |
When reviewing these averages, remember that career length dramatically sways the results. A worker who logged 30 years in state service collects far more than someone who left after eight years.
Many systems report broad averages that lump together short-tenure former employees with 35-year career veterans. Full-career public employees often average between $45,000 and $65,000 per year in top-tier states.
The Non-Social Security Factor: Why Some State Averages Look Massive
If you look at the average pension by state and notice staggering payouts in Nevada, Ohio, or Illinois, context is critical. Workers in these states often do not participate in Social Security.
Approximately 15 states allow public school districts or state agencies to opt out of the federal Social Security system. Employees do not pay the 6.2% FICA payroll tax on those earnings.
Because these retirees cannot collect standard Social Security from their public jobs, their state pensions must replace both retirement benefits. Their formulas use higher multipliers to compensate for the missing federal safety net.
You must also monitor federal reduction rules if you earned Social Security credits in the private sector before taking a non-covered public job. Federal rules can significantly reduce your private Social Security entitlement.
The Windfall Elimination Provision (WEP) cuts your personal Social Security retirement check if you receive a non-covered pension. You can review official offset formulas directly on the Social Security Administration (SSA) portal.
Similarly, the Government Pension Offset (GPO) can reduce or completely wipe out any spousal or survivor Social Security benefits you expected to claim. Knowing these rules ensures you calculate your true net retirement income accurately.
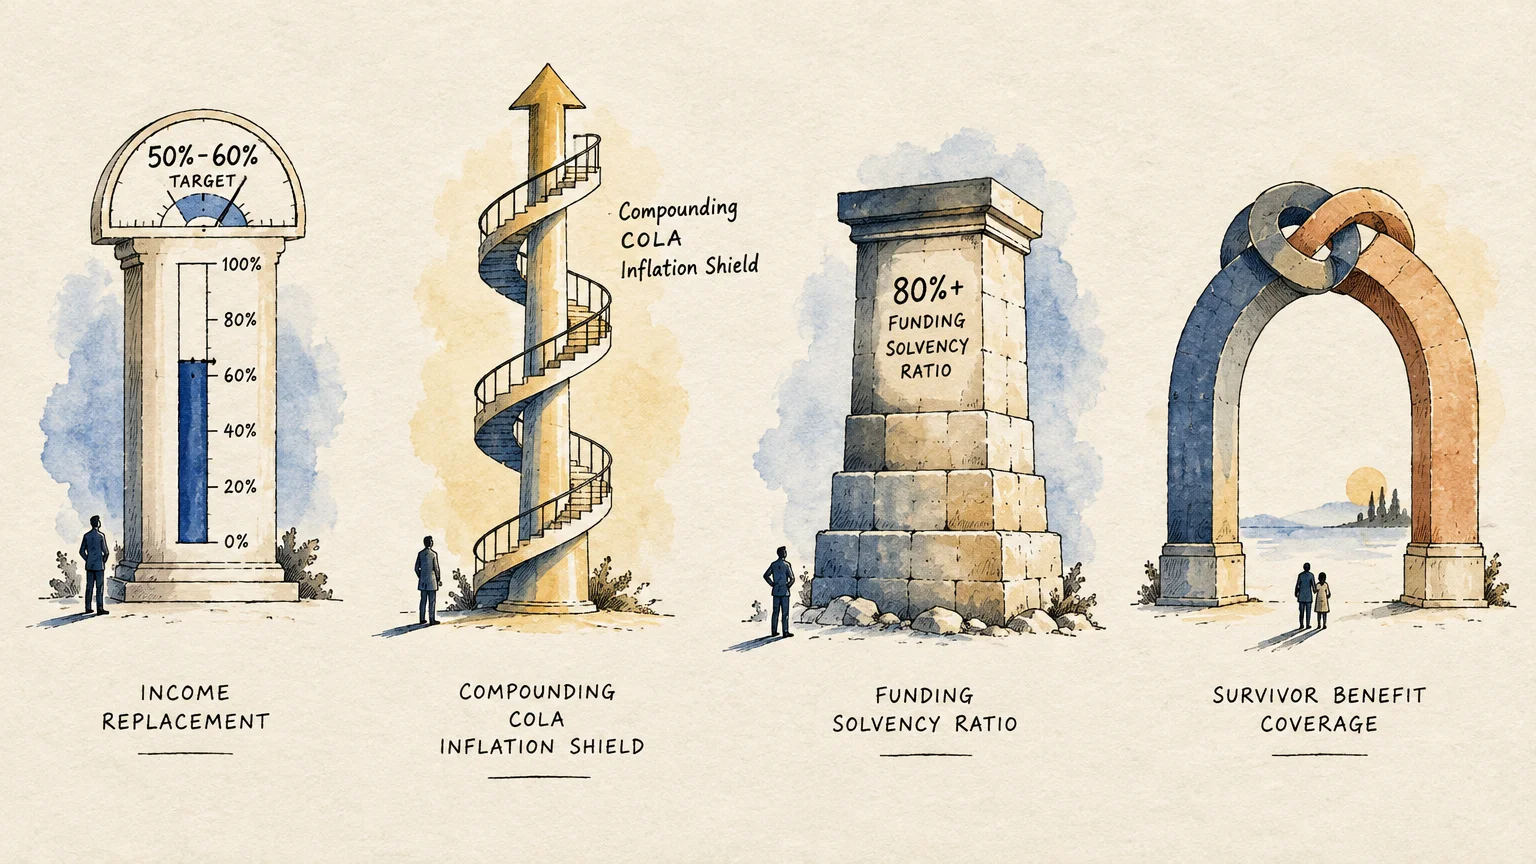
Anatomy of a “Good” Pension: 4 Crucial Benchmarks
How can you determine whether your pension is genuinely good, average, or subpar? A quality pension balances adequate wage replacement, inflation protection, and dependable funding.
Use these four practical benchmarks to evaluate your plan’s real-world strength.
1. The Service Multiplier
Defined-benefit plans calculate your check using years of service multiplied by an accrual factor and your final average salary. That accrual percentage is your plan’s multiplier.
A standard public pension multiplier ranges from 1.5% to 2.0% per year of credited service. If you work 30 years under a 2.0% multiplier, your pension replaces 60% of your highest earnings.
In states where workers do not receive Social Security, multipliers often reach 2.2% to 2.5%. Anything below 1.5% in the public sector or 1.0% in private corporate plans represents a relatively weak formula.
2. Cost-of-Living Adjustments (COLAs)
A high starting monthly pension can rapidly lose its purchasing power if it lacks an annual inflation raise. Over a 25-year retirement, a 3% annual inflation rate cuts your real purchasing power in half.
The best pensions offer an automatic, compounded annual COLA tied directly to the Consumer Price Index (CPI), typically capped at 2% or 3%. These provisions protect your lifestyle through economic cycles.
Weaker plans provide only simple (non-compounding) COLAs, ad-hoc adjustments subject to legislative approval, or no inflation adjustments whatsoever. Most private corporate pensions offer zero COLA increases after retirement.
3. Total Income Replacement Rate
Most certified financial planners suggest that retirees need to replace 70% to 80% of their pre-retirement gross earnings. This maintains your standard of living without draining reserves.
If your pension replaces 50% to 60% of your final pay, you only need an extra 15% to 20% from personal savings or Social Security. That structure provides an exceptional foundation for worry-free living.
If your pension replaces less than 30% of your earnings, your defined-benefit check operates merely as a supplement. You will depend heavily on 401(k) balances, IRAs, and Social Security to bridge the gap.
4. Plan Funded Ratio and Stability
A pension promise is only as reliable as the trust fund backing it up. Actuaries measure plan solvency using a metric called the funded ratio, which compares plan assets against future liabilities.
A healthy pension maintains a funded ratio of 80% or higher. Systems like Wisconsin and South Dakota frequently maintain funded ratios near or above 100%, guaranteeing complete benefit security.
Plans that fall below a 60% funded ratio face long-term fiscal stress. While states rarely default on existing retiree checks, underfunded systems frequently freeze COLAs or hike employee contributions for newer tiers.
“It’s not how much money you make, but how much money you keep, how hard it works for you, and how many generations you keep it for.” — Robert Kiyosaki

State Taxes: How Much of Your Pension Will You Actually Keep?
Your gross pension payout is only part of the equation; your state tax authority controls the rest. State tax policies significantly sway your ultimate spendable cash flow.
Nine states charge no state income tax on any personal income, including public and private pensions. These tax-free destinations include Alaska, Florida, Nevada, New Hampshire, South Dakota, Tennessee, Texas, Washington, and Wyoming.
Several other states maintain broad tax exemptions specifically targeted at retirement income. For instance, Pennsylvania and Mississippi completely exempt all qualified public and private pension distributions from state personal income tax.
Illinois and Iowa also exempt qualified pension payments from state taxation, allowing retirees to keep 100% of their checks. Other states provide partial exclusions up to specific dollar thresholds based on age and income.
Conversely, states like California, Vermont, and Minnesota tax pension payments as regular income with minimal or no senior tax carve-outs. You can inspect specific federal distribution rules via IRS Retirement Plans guidelines.
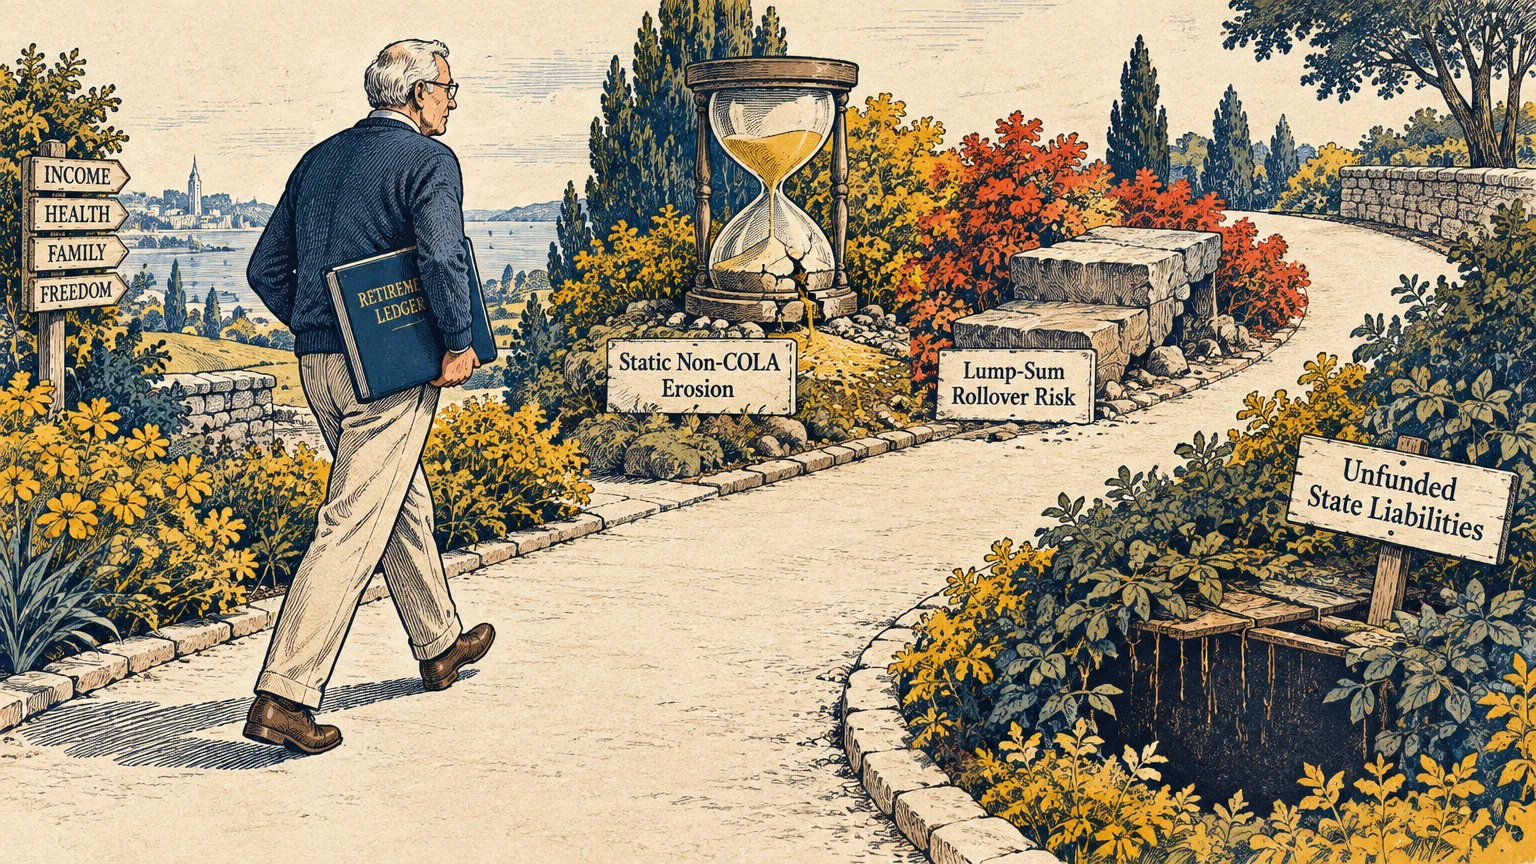
Common Retirement Traps
Navigating defined-benefit pensions involves complex financial choices that can permanently impact your household budget. Watch out for these four frequent errors when coordinating your payout strategy.
Trap 1: Underestimating Inflation on Fixed Benefits. Accepting a slightly higher initial monthly payout that lacks a COLA often backfires. A smaller starting check with a compounded 2% annual raise easily surpasses a flat payout after ten to fifteen years.
Trap 2: Forgetting the Social Security Offset. If you worked as a teacher, police officer, or municipal employee in a non-covered state, do not plan on full spousal Social Security. WEP and GPO offsets frequently surprise retirees by reducing expected federal benefits.
Trap 3: Picking Single-Life Payouts Without Spousal Protection. Choosing the single-life payout gives you the biggest possible monthly check while you are alive. However, that benefit terminates immediately upon your death, leaving your surviving spouse with zero ongoing pension income.
Trap 4: Taking Lump-Sum Buyouts Without Professional Analysis. Companies often offer pension buyouts to remove balance-sheet risk. Cashing out transfers all investment risk, market volatility, and longevity risk directly onto your shoulders.

When to Consult a Professional
Deciding when and how to take your pension is an irreversible decision that warrants professional oversight. Unlike a traditional investment portfolio, you cannot change your pension payout election once your benefit checks begin.
You should consult a fee-only, fiduciary financial planner before selecting your final payout option. A qualified fiduciary will model single-life versus joint-and-survivor payouts alongside your family medical history and other assets.
Speak with a certified tax professional or CPA if you plan on relocating to another state during retirement. They will calculate the exact tax differentials across jurisdictions and ensure proper withholding.
If your career spanned both public service and private employment, consult a Social Security claiming specialist. You can explore retirement counseling tools through the Consumer Financial Protection Bureau (CFPB) — Retirement hub.
Frequently Asked Questions
Is a $2,000 monthly pension considered good?
A $2,000 monthly pension ($24,000 annually) sits right near the national median for state and local government retirees. If you also receive full Social Security benefits, a $2,000 pension provides a very stable financial floor.
However, if you live in a high-cost state or do not collect Social Security, $2,000 per month will require substantial support from personal retirement savings.
Why are public pensions so much higher than private pensions?
Public sector workers typically stay with their employers longer, which increases their service multipliers. Government employers also contribute higher percentages of overall payroll toward retirement programs in place of competitive private-sector stock compensation.
Additionally, many public sector positions negotiate benefits through collective bargaining unions, preserving defined-benefit formulas that private corporations abandoned decades ago.
Can my state change or cut my pension after I retire?
In almost all states, your accrued pension benefit is legally protected by state constitutional provisions or established contract law. States cannot legally reduce benefit checks for workers who are already retired.
However, state legislatures can modify future cost-of-living adjustments, change healthcare subsidies, or alter contribution rates and multipliers for newly hired workers.
Should I take a lump sum or monthly annuity payments?
Monthly annuity payments guarantee income that you cannot outlive, removing stock market risk and management burdens. This guaranteed longevity hedge makes the monthly annuity the safer choice for most retirees.
A lump-sum rollover makes sense primarily if you suffer from severe health issues that shorten life expectancy, or if your plan faces catastrophic underfunding without state guarantees.
Evaluate your pension within the context of your complete retirement picture. Review your multiplier, verify your inflation protections, and check your state’s tax laws to ensure your income keeps pace with your dreams.
This article is for informational purposes only and does not constitute financial, legal, or medical advice. Medicare rules, Social Security benefits, and tax laws change regularly—verify current details at Medicare.gov, SSA.gov, or with a licensed professional.
Last updated: February 2026. Medicare and Social Security rules change annually—always verify current details at official government sources.